Welcome to Mobilarian Forum - Official Symbianize forum.

Join us now to get access to all our features. Once registered and logged in, you will be able to create topics, post replies to existing threads, give reputation to your fellow members, get your own private messenger, and so, so much more. It's also quick and totally free, so what are you waiting for?

Mastering Excel - Excel From Beginner To Advanced

Alexhost
O 0

oaxino

Alpha and Omega
Member
Access
Joined
Nov 24, 2022
Messages
30,024
Reaction score
858
Points
113
Age
35
Location
japanse
grants
₲89,681
1 years of service

2636d332923594de8773b4565f9b74bb.jpeg

Mastering Excel - Excel From Beginner To Advanced
Published 2/2023
MP4 | Video: h264, 1280x720 | Audio: AAC, 44.1 KHz
Language: English | Size: 4.13 GB | Duration: 5h 26m

The complete Excel course compatible with MS Office 365, or any version of Excel​

What you'll learn
Master Microsoft Excel from Beginner to Advanced
Master unique tips & techniques that you won't find in ANY other course, guaranteed
Basic data entry and manipulation
Data analysis
Requirements
No Prior Excel Knowledge Required
Microsoft Excel 2007, 2010, 2013, 2013, 2019 or Microsoft 365 Excel Loaded on Computer to Follow Along with Instructor Lectures is Recommended
Description
Students: Excel is commonly used in many fields of study, including science, finance, and business, and having a strong understanding of the program can help students succeed in their coursework.Professionals: Excel is a powerful tool for data analysis and management, and professionals in fields such as accounting, finance, marketing, and project management can benefit from a deep understanding of the program.Entrepreneurs: Excel can help entrepreneurs manage their finances and track their business growth, as well as create marketing plans and analyze customer data.Job seekers: Many jobs require knowledge of Excel, so taking an Excel course can make job seekers more competitive in the job market.Anyone looking to improve their productivity: Excel can be used to streamline many different tasks, from creating lists and charts to managing schedules and budgets.You can learn how to enter and format data in Excel, including how to add, delete, and modify cells and rows, format numbers and text, and use Excel's built-in functions to manipulate data.Excel provides a wide range of data analysis tools, including pivot tables, data sorting and filtering, and various statistical functions. You can use these tools to explore and understand large data sets and to identify trends, patterns, and outliers.Excel is widely used for financial modeling, including creating and analyzing financial statements, forecasting revenue and expenses, and conducting sensitivity analysis. By learning how to use Excel for financial modeling, you can develop a range of valuable skills that are highly sought after by employers.Excel also includes a variety of tools for creating graphs and charts to help you visualize your data. You can learn how to create different types of graphs and charts, including bar graphs, line charts, pie charts, and more.Overall, an Excel course is for anyone who wants to improve their knowledge and skills with the program, regardless of their background or profession.
Overview
Section 1: Introduction
Lecture 1 Microsoft Excel Tutorial - Beginners Level 1
Lecture 2 Microsoft Excel Tutorial - Beginners Level 2
Lecture 3 Microsoft Excel Tutorial - Beginners Level 3
Lecture 4 Microsoft Excel Tutorial - Beginners Level 4
Lecture 5 Microsoft Excel Tutorial - Beginners Level 5
Section 2: lookup Function in Excel for Beginners
Lecture 6 Vlookup Function
Lecture 7 Xlookup Function
Section 3: 10 Best Excel Tips for Beginners
Lecture 8 10 Best Excel Tips
Section 4: Tabels
Lecture 9 7 Reasons Why you Should use Excel Tables
Section 5: Dropdown
Lecture 10 How to Create Drop-Down List in Excel
Lecture 11 Quickly Create Multiple Dependent Drop-Down Lists in Microsoft Excel
Section 6: Pivot Table
Lecture 12 Excel Pivot Table Tutorial for Beginners
Section 7: Cells Formatting
Lecture 13 Combine Text and Numbers into One Cell in Excel
Lecture 14 Learn Different Ways to Combine Cells in Microsoft Excel
Lecture 15 4 Ways to Split Cells in Microsoft Excel
Section 8: Charts and Graphs in Excel
Lecture 16 How to Create Charts and Graphs in Microsoft Excel - Quick and Simple
Lecture 17 How to Make a Line Graph in Excel - From Simple to Scientific
Section 9: VBA in excel
Lecture 18 Quickly Create an Excel Data Entry Form Without VBA
Section 10: Password Protect your Microsoft Excel Files
Lecture 19 3 Ways to Password Protect your Microsoft Excel Files
Section 11: 3D Formulas in Excel
Lecture 20 How to QUICKLY Use 3D Formulas in Excel
Section 12: Extras
Lecture 21 Relative vs Absolute Cell Reference in Microsoft Excel - What's the difference
Lecture 22 How to use Formulas and Functions in Microsoft Excel
Basic data entry and manipulation: You can learn how to enter and format data in Excel, including how to add, delete, and modify cells and rows, format numbers and text, and use Excel's built-in functions to manipulate data. Data analysis: Excel provides a wide range of data analysis tools, including pivot tables, data sorting and filtering, and various statistical functions. You can use these tools to explore and understand large data sets and to identify trends, patterns, and outliers. Financial modeling: Excel is widely used for financial modeling, including creating and analyzing financial statements, forecasting revenue and expenses, and conducting sensitivity analysis. By learning how to use Excel for financial modeling, you can develop a range of valuable skills that are highly sought after by employers. Graphs and charts: Excel also includes a variety of tools for creating graphs and charts to help you visualize your data. You can learn how to create different types of graphs and charts, including bar graphs, line charts, pie charts, and more. Automation: Finally, Excel includes a range of automation tools, including macros and scripting, that can help you automate repetitive tasks and streamline your workflow. By learning how to use these tools, you can increase your efficiency and productivity, and make your work with Excel more enjoyable and rewarding.
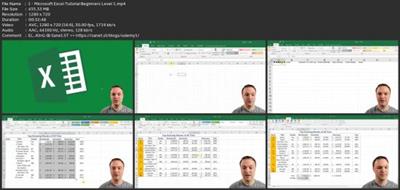
e4e42cff859d24979458b1af1f068102.jpeg

Download link

rapidgator.net:
You must reply in thread to view hidden text.

uploadgig.com:
You must reply in thread to view hidden text.

nitroflare.com:
You must reply in thread to view hidden text.
 
K 0

KatzSec DevOps

Alpha and Omega
Philanthropist
Access
Joined
Jan 17, 2022
Messages
598,584
Reaction score
7,801
Points
83
grants
₲58,307
2 years of service
oaxino salamat sa pag contribute. Next time always upload your files sa
Please, Log in or Register to view URLs content!
para siguradong di ma dedeadlink. Let's keep on sharing to keep our community running for good. This community is built for you and everyone to share freely. Let's invite more contributors para mabalik natin sigla ng Mobilarian at tuloy ang puyatan. :)
 
Z 0

zvonchica

Transcendent
Member
Joined
Mar 10, 2023
Messages
11
Reaction score
0
Points
1
Age
32
Location
Serbia
grants
₲135
1 years of service

2636d332923594de8773b4565f9b74bb.jpeg


Mastering Excel - Excel From Beginner To Advanced
Published 2/2023
MP4 | Video: h264, 1280x720 | Audio: AAC, 44.1 KHz
Language: English | Size: 4.13 GB | Duration: 5h 26m

The complete Excel course compatible with MS Office 365, or any version of Excel​

What you'll learn
Master Microsoft Excel from Beginner to Advanced
Master unique tips & techniques that you won't find in ANY other course, guaranteed
Basic data entry and manipulation
Data analysis
Requirements
No Prior Excel Knowledge Required
Microsoft Excel 2007, 2010, 2013, 2013, 2019 or Microsoft 365 Excel Loaded on Computer to Follow Along with Instructor Lectures is Recommended
Description
Students: Excel is commonly used in many fields of study, including science, finance, and business, and having a strong understanding of the program can help students succeed in their coursework.Professionals: Excel is a powerful tool for data analysis and management, and professionals in fields such as accounting, finance, marketing, and project management can benefit from a deep understanding of the program.Entrepreneurs: Excel can help entrepreneurs manage their finances and track their business growth, as well as create marketing plans and analyze customer data.Job seekers: Many jobs require knowledge of Excel, so taking an Excel course can make job seekers more competitive in the job market.Anyone looking to improve their productivity: Excel can be used to streamline many different tasks, from creating lists and charts to managing schedules and budgets.You can learn how to enter and format data in Excel, including how to add, delete, and modify cells and rows, format numbers and text, and use Excel's built-in functions to manipulate data.Excel provides a wide range of data analysis tools, including pivot tables, data sorting and filtering, and various statistical functions. You can use these tools to explore and understand large data sets and to identify trends, patterns, and outliers.Excel is widely used for financial modeling, including creating and analyzing financial statements, forecasting revenue and expenses, and conducting sensitivity analysis. By learning how to use Excel for financial modeling, you can develop a range of valuable skills that are highly sought after by employers.Excel also includes a variety of tools for creating graphs and charts to help you visualize your data. You can learn how to create different types of graphs and charts, including bar graphs, line charts, pie charts, and more.Overall, an Excel course is for anyone who wants to improve their knowledge and skills with the program, regardless of their background or profession.
Overview
Section 1: Introduction
Lecture 1 Microsoft Excel Tutorial - Beginners Level 1
Lecture 2 Microsoft Excel Tutorial - Beginners Level 2
Lecture 3 Microsoft Excel Tutorial - Beginners Level 3
Lecture 4 Microsoft Excel Tutorial - Beginners Level 4
Lecture 5 Microsoft Excel Tutorial - Beginners Level 5
Section 2: lookup Function in Excel for Beginners
Lecture 6 Vlookup Function
Lecture 7 Xlookup Function
Section 3: 10 Best Excel Tips for Beginners
Lecture 8 10 Best Excel Tips
Section 4: Tabels
Lecture 9 7 Reasons Why you Should use Excel Tables
Section 5: Dropdown
Lecture 10 How to Create Drop-Down List in Excel
Lecture 11 Quickly Create Multiple Dependent Drop-Down Lists in Microsoft Excel
Section 6: Pivot Table
Lecture 12 Excel Pivot Table Tutorial for Beginners
Section 7: Cells Formatting
Lecture 13 Combine Text and Numbers into One Cell in Excel
Lecture 14 Learn Different Ways to Combine Cells in Microsoft Excel
Lecture 15 4 Ways to Split Cells in Microsoft Excel
Section 8: Charts and Graphs in Excel
Lecture 16 How to Create Charts and Graphs in Microsoft Excel - Quick and Simple
Lecture 17 How to Make a Line Graph in Excel - From Simple to Scientific
Section 9: VBA in excel
Lecture 18 Quickly Create an Excel Data Entry Form Without VBA
Section 10: Password Protect your Microsoft Excel Files
Lecture 19 3 Ways to Password Protect your Microsoft Excel Files
Section 11: 3D Formulas in Excel
Lecture 20 How to QUICKLY Use 3D Formulas in Excel
Section 12: Extras
Lecture 21 Relative vs Absolute Cell Reference in Microsoft Excel - What's the difference
Lecture 22 How to use Formulas and Functions in Microsoft Excel
Basic data entry and manipulation: You can learn how to enter and format data in Excel, including how to add, delete, and modify cells and rows, format numbers and text, and use Excel's built-in functions to manipulate data. Data analysis: Excel provides a wide range of data analysis tools, including pivot tables, data sorting and filtering, and various statistical functions. You can use these tools to explore and understand large data sets and to identify trends, patterns, and outliers. Financial modeling: Excel is widely used for financial modeling, including creating and analyzing financial statements, forecasting revenue and expenses, and conducting sensitivity analysis. By learning how to use Excel for financial modeling, you can develop a range of valuable skills that are highly sought after by employers. Graphs and charts: Excel also includes a variety of tools for creating graphs and charts to help you visualize your data. You can learn how to create different types of graphs and charts, including bar graphs, line charts, pie charts, and more. Automation: Finally, Excel includes a range of automation tools, including macros and scripting, that can help you automate repetitive tasks and streamline your workflow. By learning how to use these tools, you can increase your efficiency and productivity, and make your work with Excel more enjoyable and rewarding.

e4e42cff859d24979458b1af1f068102.jpeg

Download link

rapidgator.net
:
*** Hidden text: cannot be quoted. ***


uploadgig.com:
*** Hidden text: cannot be quoted. ***


nitroflare.com:
*** Hidden text: cannot be quoted. ***
Thank you so much! :)
 
C 0

caascava

Abecedarian
Member
Access
Joined
Apr 26, 2023
Messages
74
Reaction score
35
Points
18
grants
₲381
1 years of service

2636d332923594de8773b4565f9b74bb.jpeg


Mastering Excel - Excel From Beginner To Advanced
Published 2/2023
MP4 | Video: h264, 1280x720 | Audio: AAC, 44.1 KHz
Language: English | Size: 4.13 GB | Duration: 5h 26m

The complete Excel course compatible with MS Office 365, or any version of Excel​

What you'll learn
Master Microsoft Excel from Beginner to Advanced
Master unique tips & techniques that you won't find in ANY other course, guaranteed
Basic data entry and manipulation
Data analysis
Requirements
No Prior Excel Knowledge Required
Microsoft Excel 2007, 2010, 2013, 2013, 2019 or Microsoft 365 Excel Loaded on Computer to Follow Along with Instructor Lectures is Recommended
Description
Students: Excel is commonly used in many fields of study, including science, finance, and business, and having a strong understanding of the program can help students succeed in their coursework.Professionals: Excel is a powerful tool for data analysis and management, and professionals in fields such as accounting, finance, marketing, and project management can benefit from a deep understanding of the program.Entrepreneurs: Excel can help entrepreneurs manage their finances and track their business growth, as well as create marketing plans and analyze customer data.Job seekers: Many jobs require knowledge of Excel, so taking an Excel course can make job seekers more competitive in the job market.Anyone looking to improve their productivity: Excel can be used to streamline many different tasks, from creating lists and charts to managing schedules and budgets.You can learn how to enter and format data in Excel, including how to add, delete, and modify cells and rows, format numbers and text, and use Excel's built-in functions to manipulate data.Excel provides a wide range of data analysis tools, including pivot tables, data sorting and filtering, and various statistical functions. You can use these tools to explore and understand large data sets and to identify trends, patterns, and outliers.Excel is widely used for financial modeling, including creating and analyzing financial statements, forecasting revenue and expenses, and conducting sensitivity analysis. By learning how to use Excel for financial modeling, you can develop a range of valuable skills that are highly sought after by employers.Excel also includes a variety of tools for creating graphs and charts to help you visualize your data. You can learn how to create different types of graphs and charts, including bar graphs, line charts, pie charts, and more.Overall, an Excel course is for anyone who wants to improve their knowledge and skills with the program, regardless of their background or profession.
Overview
Section 1: Introduction
Lecture 1 Microsoft Excel Tutorial - Beginners Level 1
Lecture 2 Microsoft Excel Tutorial - Beginners Level 2
Lecture 3 Microsoft Excel Tutorial - Beginners Level 3
Lecture 4 Microsoft Excel Tutorial - Beginners Level 4
Lecture 5 Microsoft Excel Tutorial - Beginners Level 5
Section 2: lookup Function in Excel for Beginners
Lecture 6 Vlookup Function
Lecture 7 Xlookup Function
Section 3: 10 Best Excel Tips for Beginners
Lecture 8 10 Best Excel Tips
Section 4: Tabels
Lecture 9 7 Reasons Why you Should use Excel Tables
Section 5: Dropdown
Lecture 10 How to Create Drop-Down List in Excel
Lecture 11 Quickly Create Multiple Dependent Drop-Down Lists in Microsoft Excel
Section 6: Pivot Table
Lecture 12 Excel Pivot Table Tutorial for Beginners
Section 7: Cells Formatting
Lecture 13 Combine Text and Numbers into One Cell in Excel
Lecture 14 Learn Different Ways to Combine Cells in Microsoft Excel
Lecture 15 4 Ways to Split Cells in Microsoft Excel
Section 8: Charts and Graphs in Excel
Lecture 16 How to Create Charts and Graphs in Microsoft Excel - Quick and Simple
Lecture 17 How to Make a Line Graph in Excel - From Simple to Scientific
Section 9: VBA in excel
Lecture 18 Quickly Create an Excel Data Entry Form Without VBA
Section 10: Password Protect your Microsoft Excel Files
Lecture 19 3 Ways to Password Protect your Microsoft Excel Files
Section 11: 3D Formulas in Excel
Lecture 20 How to QUICKLY Use 3D Formulas in Excel
Section 12: Extras
Lecture 21 Relative vs Absolute Cell Reference in Microsoft Excel - What's the difference
Lecture 22 How to use Formulas and Functions in Microsoft Excel
Basic data entry and manipulation: You can learn how to enter and format data in Excel, including how to add, delete, and modify cells and rows, format numbers and text, and use Excel's built-in functions to manipulate data. Data analysis: Excel provides a wide range of data analysis tools, including pivot tables, data sorting and filtering, and various statistical functions. You can use these tools to explore and understand large data sets and to identify trends, patterns, and outliers. Financial modeling: Excel is widely used for financial modeling, including creating and analyzing financial statements, forecasting revenue and expenses, and conducting sensitivity analysis. By learning how to use Excel for financial modeling, you can develop a range of valuable skills that are highly sought after by employers. Graphs and charts: Excel also includes a variety of tools for creating graphs and charts to help you visualize your data. You can learn how to create different types of graphs and charts, including bar graphs, line charts, pie charts, and more. Automation: Finally, Excel includes a range of automation tools, including macros and scripting, that can help you automate repetitive tasks and streamline your workflow. By learning how to use these tools, you can increase your efficiency and productivity, and make your work with Excel more enjoyable and rewarding.

e4e42cff859d24979458b1af1f068102.jpeg

Download link

rapidgator.net
:
*** Hidden text: cannot be quoted. ***


uploadgig.com:
*** Hidden text: cannot be quoted. ***


nitroflare.com:
*** Hidden text: cannot be quoted. ***
salamat boss
 
L 0

LOLOLOL1324

Transcendent
BANNED
Member
Access
Joined
Jun 4, 2023
Messages
46
Reaction score
1
Points
8
grants
₲136
1 years of service

2636d332923594de8773b4565f9b74bb.jpeg


Mastering Excel - Excel From Beginner To Advanced
Published 2/2023
MP4 | Video: h264, 1280x720 | Audio: AAC, 44.1 KHz
Language: English | Size: 4.13 GB | Duration: 5h 26m

The complete Excel course compatible with MS Office 365, or any version of Excel​

What you'll learn
Master Microsoft Excel from Beginner to Advanced
Master unique tips & techniques that you won't find in ANY other course, guaranteed
Basic data entry and manipulation
Data analysis
Requirements
No Prior Excel Knowledge Required
Microsoft Excel 2007, 2010, 2013, 2013, 2019 or Microsoft 365 Excel Loaded on Computer to Follow Along with Instructor Lectures is Recommended
Description
Students: Excel is commonly used in many fields of study, including science, finance, and business, and having a strong understanding of the program can help students succeed in their coursework.Professionals: Excel is a powerful tool for data analysis and management, and professionals in fields such as accounting, finance, marketing, and project management can benefit from a deep understanding of the program.Entrepreneurs: Excel can help entrepreneurs manage their finances and track their business growth, as well as create marketing plans and analyze customer data.Job seekers: Many jobs require knowledge of Excel, so taking an Excel course can make job seekers more competitive in the job market.Anyone looking to improve their productivity: Excel can be used to streamline many different tasks, from creating lists and charts to managing schedules and budgets.You can learn how to enter and format data in Excel, including how to add, delete, and modify cells and rows, format numbers and text, and use Excel's built-in functions to manipulate data.Excel provides a wide range of data analysis tools, including pivot tables, data sorting and filtering, and various statistical functions. You can use these tools to explore and understand large data sets and to identify trends, patterns, and outliers.Excel is widely used for financial modeling, including creating and analyzing financial statements, forecasting revenue and expenses, and conducting sensitivity analysis. By learning how to use Excel for financial modeling, you can develop a range of valuable skills that are highly sought after by employers.Excel also includes a variety of tools for creating graphs and charts to help you visualize your data. You can learn how to create different types of graphs and charts, including bar graphs, line charts, pie charts, and more.Overall, an Excel course is for anyone who wants to improve their knowledge and skills with the program, regardless of their background or profession.
Overview
Section 1: Introduction
Lecture 1 Microsoft Excel Tutorial - Beginners Level 1
Lecture 2 Microsoft Excel Tutorial - Beginners Level 2
Lecture 3 Microsoft Excel Tutorial - Beginners Level 3
Lecture 4 Microsoft Excel Tutorial - Beginners Level 4
Lecture 5 Microsoft Excel Tutorial - Beginners Level 5
Section 2: lookup Function in Excel for Beginners
Lecture 6 Vlookup Function
Lecture 7 Xlookup Function
Section 3: 10 Best Excel Tips for Beginners
Lecture 8 10 Best Excel Tips
Section 4: Tabels
Lecture 9 7 Reasons Why you Should use Excel Tables
Section 5: Dropdown
Lecture 10 How to Create Drop-Down List in Excel
Lecture 11 Quickly Create Multiple Dependent Drop-Down Lists in Microsoft Excel
Section 6: Pivot Table
Lecture 12 Excel Pivot Table Tutorial for Beginners
Section 7: Cells Formatting
Lecture 13 Combine Text and Numbers into One Cell in Excel
Lecture 14 Learn Different Ways to Combine Cells in Microsoft Excel
Lecture 15 4 Ways to Split Cells in Microsoft Excel
Section 8: Charts and Graphs in Excel
Lecture 16 How to Create Charts and Graphs in Microsoft Excel - Quick and Simple
Lecture 17 How to Make a Line Graph in Excel - From Simple to Scientific
Section 9: VBA in excel
Lecture 18 Quickly Create an Excel Data Entry Form Without VBA
Section 10: Password Protect your Microsoft Excel Files
Lecture 19 3 Ways to Password Protect your Microsoft Excel Files
Section 11: 3D Formulas in Excel
Lecture 20 How to QUICKLY Use 3D Formulas in Excel
Section 12: Extras
Lecture 21 Relative vs Absolute Cell Reference in Microsoft Excel - What's the difference
Lecture 22 How to use Formulas and Functions in Microsoft Excel
Basic data entry and manipulation: You can learn how to enter and format data in Excel, including how to add, delete, and modify cells and rows, format numbers and text, and use Excel's built-in functions to manipulate data. Data analysis: Excel provides a wide range of data analysis tools, including pivot tables, data sorting and filtering, and various statistical functions. You can use these tools to explore and understand large data sets and to identify trends, patterns, and outliers. Financial modeling: Excel is widely used for financial modeling, including creating and analyzing financial statements, forecasting revenue and expenses, and conducting sensitivity analysis. By learning how to use Excel for financial modeling, you can develop a range of valuable skills that are highly sought after by employers. Graphs and charts: Excel also includes a variety of tools for creating graphs and charts to help you visualize your data. You can learn how to create different types of graphs and charts, including bar graphs, line charts, pie charts, and more. Automation: Finally, Excel includes a range of automation tools, including macros and scripting, that can help you automate repetitive tasks and streamline your workflow. By learning how to use these tools, you can increase your efficiency and productivity, and make your work with Excel more enjoyable and rewarding.

e4e42cff859d24979458b1af1f068102.jpeg

Download link

rapidgator.net
:
*** Hidden text: cannot be quoted. ***


uploadgig.com:
*** Hidden text: cannot be quoted. ***


nitroflare.com:
*** Hidden text: cannot be quoted. ***
salamat po for tgis
 
E 0

ewankodin

Transcendent
BANNED
Member
Access
Joined
Dec 23, 2022
Messages
40
Reaction score
2
Points
8
Age
24
Location
ph
grants
₲140
1 years of service

2636d332923594de8773b4565f9b74bb.jpeg


Mastering Excel - Excel From Beginner To Advanced
Published 2/2023
MP4 | Video: h264, 1280x720 | Audio: AAC, 44.1 KHz
Language: English | Size: 4.13 GB | Duration: 5h 26m

The complete Excel course compatible with MS Office 365, or any version of Excel​

What you'll learn
Master Microsoft Excel from Beginner to Advanced
Master unique tips & techniques that you won't find in ANY other course, guaranteed
Basic data entry and manipulation
Data analysis
Requirements
No Prior Excel Knowledge Required
Microsoft Excel 2007, 2010, 2013, 2013, 2019 or Microsoft 365 Excel Loaded on Computer to Follow Along with Instructor Lectures is Recommended
Description
Students: Excel is commonly used in many fields of study, including science, finance, and business, and having a strong understanding of the program can help students succeed in their coursework.Professionals: Excel is a powerful tool for data analysis and management, and professionals in fields such as accounting, finance, marketing, and project management can benefit from a deep understanding of the program.Entrepreneurs: Excel can help entrepreneurs manage their finances and track their business growth, as well as create marketing plans and analyze customer data.Job seekers: Many jobs require knowledge of Excel, so taking an Excel course can make job seekers more competitive in the job market.Anyone looking to improve their productivity: Excel can be used to streamline many different tasks, from creating lists and charts to managing schedules and budgets.You can learn how to enter and format data in Excel, including how to add, delete, and modify cells and rows, format numbers and text, and use Excel's built-in functions to manipulate data.Excel provides a wide range of data analysis tools, including pivot tables, data sorting and filtering, and various statistical functions. You can use these tools to explore and understand large data sets and to identify trends, patterns, and outliers.Excel is widely used for financial modeling, including creating and analyzing financial statements, forecasting revenue and expenses, and conducting sensitivity analysis. By learning how to use Excel for financial modeling, you can develop a range of valuable skills that are highly sought after by employers.Excel also includes a variety of tools for creating graphs and charts to help you visualize your data. You can learn how to create different types of graphs and charts, including bar graphs, line charts, pie charts, and more.Overall, an Excel course is for anyone who wants to improve their knowledge and skills with the program, regardless of their background or profession.
Overview
Section 1: Introduction
Lecture 1 Microsoft Excel Tutorial - Beginners Level 1
Lecture 2 Microsoft Excel Tutorial - Beginners Level 2
Lecture 3 Microsoft Excel Tutorial - Beginners Level 3
Lecture 4 Microsoft Excel Tutorial - Beginners Level 4
Lecture 5 Microsoft Excel Tutorial - Beginners Level 5
Section 2: lookup Function in Excel for Beginners
Lecture 6 Vlookup Function
Lecture 7 Xlookup Function
Section 3: 10 Best Excel Tips for Beginners
Lecture 8 10 Best Excel Tips
Section 4: Tabels
Lecture 9 7 Reasons Why you Should use Excel Tables
Section 5: Dropdown
Lecture 10 How to Create Drop-Down List in Excel
Lecture 11 Quickly Create Multiple Dependent Drop-Down Lists in Microsoft Excel
Section 6: Pivot Table
Lecture 12 Excel Pivot Table Tutorial for Beginners
Section 7: Cells Formatting
Lecture 13 Combine Text and Numbers into One Cell in Excel
Lecture 14 Learn Different Ways to Combine Cells in Microsoft Excel
Lecture 15 4 Ways to Split Cells in Microsoft Excel
Section 8: Charts and Graphs in Excel
Lecture 16 How to Create Charts and Graphs in Microsoft Excel - Quick and Simple
Lecture 17 How to Make a Line Graph in Excel - From Simple to Scientific
Section 9: VBA in excel
Lecture 18 Quickly Create an Excel Data Entry Form Without VBA
Section 10: Password Protect your Microsoft Excel Files
Lecture 19 3 Ways to Password Protect your Microsoft Excel Files
Section 11: 3D Formulas in Excel
Lecture 20 How to QUICKLY Use 3D Formulas in Excel
Section 12: Extras
Lecture 21 Relative vs Absolute Cell Reference in Microsoft Excel - What's the difference
Lecture 22 How to use Formulas and Functions in Microsoft Excel
Basic data entry and manipulation: You can learn how to enter and format data in Excel, including how to add, delete, and modify cells and rows, format numbers and text, and use Excel's built-in functions to manipulate data. Data analysis: Excel provides a wide range of data analysis tools, including pivot tables, data sorting and filtering, and various statistical functions. You can use these tools to explore and understand large data sets and to identify trends, patterns, and outliers. Financial modeling: Excel is widely used for financial modeling, including creating and analyzing financial statements, forecasting revenue and expenses, and conducting sensitivity analysis. By learning how to use Excel for financial modeling, you can develop a range of valuable skills that are highly sought after by employers. Graphs and charts: Excel also includes a variety of tools for creating graphs and charts to help you visualize your data. You can learn how to create different types of graphs and charts, including bar graphs, line charts, pie charts, and more. Automation: Finally, Excel includes a range of automation tools, including macros and scripting, that can help you automate repetitive tasks and streamline your workflow. By learning how to use these tools, you can increase your efficiency and productivity, and make your work with Excel more enjoyable and rewarding.

e4e42cff859d24979458b1af1f068102.jpeg

Download link

rapidgator.net
:
*** Hidden text: cannot be quoted. ***


uploadgig.com:
*** Hidden text: cannot be quoted. ***


nitroflare.com:
*** Hidden text: cannot be quoted. ***
Thankyou in advanced
 
Top Bottom