
- Thread Starter
- #1
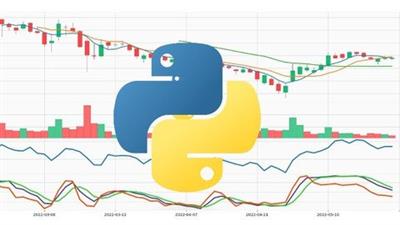
Building Technical Indicators In Python
Published 3/2023
MP4 | Video: h264, 1280x720 | Audio: AAC, 44.1 KHz
Language: English | Size: 2.66 GB | Duration: 4h 13m
Learn to use Technical Indicators in your trading Strategies using Python
Published 3/2023
MP4 | Video: h264, 1280x720 | Audio: AAC, 44.1 KHz
Language: English | Size: 2.66 GB | Duration: 4h 13m
Learn to use Technical Indicators in your trading Strategies using Python
What you'll learn
Learn how to use Python to implement technical indicators in trading and investing strategies.
Gain knowledge of various types of technical indicators, such as moving averages, RSI, MACD, Bollinger Bands, and more.
Develop a comprehensive understanding of the strengths and limitations of technical indicators, and when they should be used in combination with other forms of
Develop practical skills through hands-on exercises and examples to implement technical indicators in Python.
Understand the mathematical calculations and algorithms that are used to generate technical indicators.
Requirements
Basic knowledge of Python and Stock Trading
Description
This course will provide students with a comprehensive understanding of how to use technical indicators and candlestick patterns in stock trading.The course will start by covering the basics of technical indicators, and candlestick patterns including the use of third-party libraries in your strategy. Then, we will dive into the world of technical indicators and candlestick patterns.Some of the most popular technical indicators that we will cover in this course include Simple Moving Average (SMA), Exponential Moving Average (EMA), Relative Strength Index (RSI), Moving Average Convergence Divergence (MACD), Bollinger Bands, and Fibonacci Retracements. We will also cover popular candlestick patterns such as Doji, Hammer, and Shooting Star.To facilitate the implementation of these indicators and patterns, we will use popular libraries such as Talib, pandas TA, and tulip. We will also use popular charting libraries like matplotlib, plotly & mplfinance. These libraries will enable students to write code in Python to calculate and plot these indicators and patterns on price charts and provide them with the ability to analyze and make informed trading decisions. We will also include mathematical formulas used in these indicators along with custom code in case you want to develop your own indicator.By the end of the course, students will have a strong understanding of how technical indicators and candlestick patterns work and how to use them to make profitable trades. Students will also have the necessary skills to implement these indicators and patterns using Python, and will be well-equipped to analyze market trends and make informed trading decisions.
Overview
Section 1: Introduction
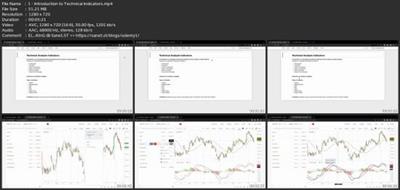
Lecture 1 Introduction to Technical Indicators
Lecture 2 Popular Technical Indicator Libraries
Section 2: Technical Analysis
Lecture 3 Moving Averages
Lecture 4 Moving Average Convergence/Divergence (MACD)
Lecture 5 Bollinger Bands
Lecture 6 Average True Range (ATR) Part 1
Lecture 7 Average True Range (ATR) Part 2
Lecture 8 Relative Strength Indicator (RSI) Part 1
Lecture 9 Relative Strength Indicator (RSI) Part 2
Lecture 10 Introduction to Supertrend
Lecture 11 Supertrend using Google Sheets/Excel
Lecture 12 Supertrend using Python
Lecture 13 Introduction to Renko
Lecture 14 Renko using Brick Size
Lecture 15 Visualize Renko Chart with ATR
Lecture 16 Introduction to ADX
Lecture 17 ADX using Google Sheet/Excel
Lecture 18 ADX using Python
Section 3: Price Action
Lecture 19 Introduction to Price Action
Lecture 20 About Candlesticks
Lecture 21 Support and Resistance
Lecture 22 Introduction to Pivot Points
Lecture 23 Pivot Points with Python
Lecture 24 Introduction to Doji
Lecture 25 Doji Candles with Python
Lecture 26 Introduction to Hammer Candles
Lecture 27 Hammer Candles with Python
Lecture 28 Introduction to Shooting Star Candle
Lecture 29 Shooting Star Candle with Python
Lecture 30 Introduction to Marubozu candles
Lecture 31 Marubozu with Python
Lecture 32 Harami Candle Pattern
Lecture 33 Engulfing Pattern
Section 4: Candlestick Pattern Scanner
Lecture 34 Slope
Lecture 35 Trendline
Lecture 36 Pattern Scanner Part 1
Lecture 37 Pattern Scanner Part 2
Lecture 38 Pattern Scanner Part 3
Section 5: Strategy Development
Lecture 39 Introduction to Strategy Development
Lecture 40 SMA Strategy Backtesting
Lecture 41 Strategy Optimization
Lecture 42 Supertrend + MACD Strategy Part 1
Lecture 43 Supertrend + MACD Strategy Part 2
Traders willing to use Technical Indicators in Algo Bots,Developers willing to develop Trading Bots for others,Students learning Data Science & Algo Trading
Download link
rapidgator.net:
You must reply in thread to view hidden text.
uploadgig.com:
You must reply in thread to view hidden text.
nitroflare.com:
You must reply in thread to view hidden text.
1dl.net:
You must reply in thread to view hidden text.
")