O
0

Janani Ravi | Duration: 2:08 h | Video: H264 1280x720 | Audio: AAC 44,1 kHz 2ch | 241 MB | Language: English
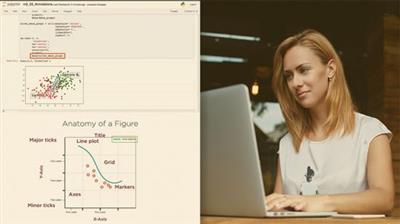
Matplotlib is one of the most popular visualization libraries used by data analysts and data scientists working in Python, but can often be intimidating to use. This course serves to make working with Matplotlib easy and simple.
This course will focus on making Matplotlib accessible and easily understandable to a Data Scientist or Business Analyst who needs to quickly and visually come to grips with relationships in a large dataset. In this course, Building Data Visualizations Using Matplotlib, you'll discover the basic components which make up a plot and see how you can tweak parameters and attributes to have the visualizations customized to exactly how you want it. First, you'll grow to understand the basic APIs available in Matplotlib and where they are used and learn how to customize the display, colors, and other attributes of these plots which will have multiple axes. Next, you'll build intermediate and advanced plots, drawing shapes and Bezier curves, using text and annotations to highlight plot elements, and normalizing the scales that are used on the x and y-axis. Lastly, you'll use some real-world data to visualize statistical data such as mean, median mode, and outliers, cover box plots, violin plots, histograms, pie charts, stem and stack plots and autocorrelations graphs. By the end of this course you'll not only have explored all the nitty gritty that Matplotlib has to offer; but you'll also be capable of building production-ready visuals to embed with your UI or to display within reports and presentations.

Download link
rapidgator.net:
You must reply in thread to view hidden text.
uploadgig.com:
You must reply in thread to view hidden text.
nitroflare.com:
You must reply in thread to view hidden text.

